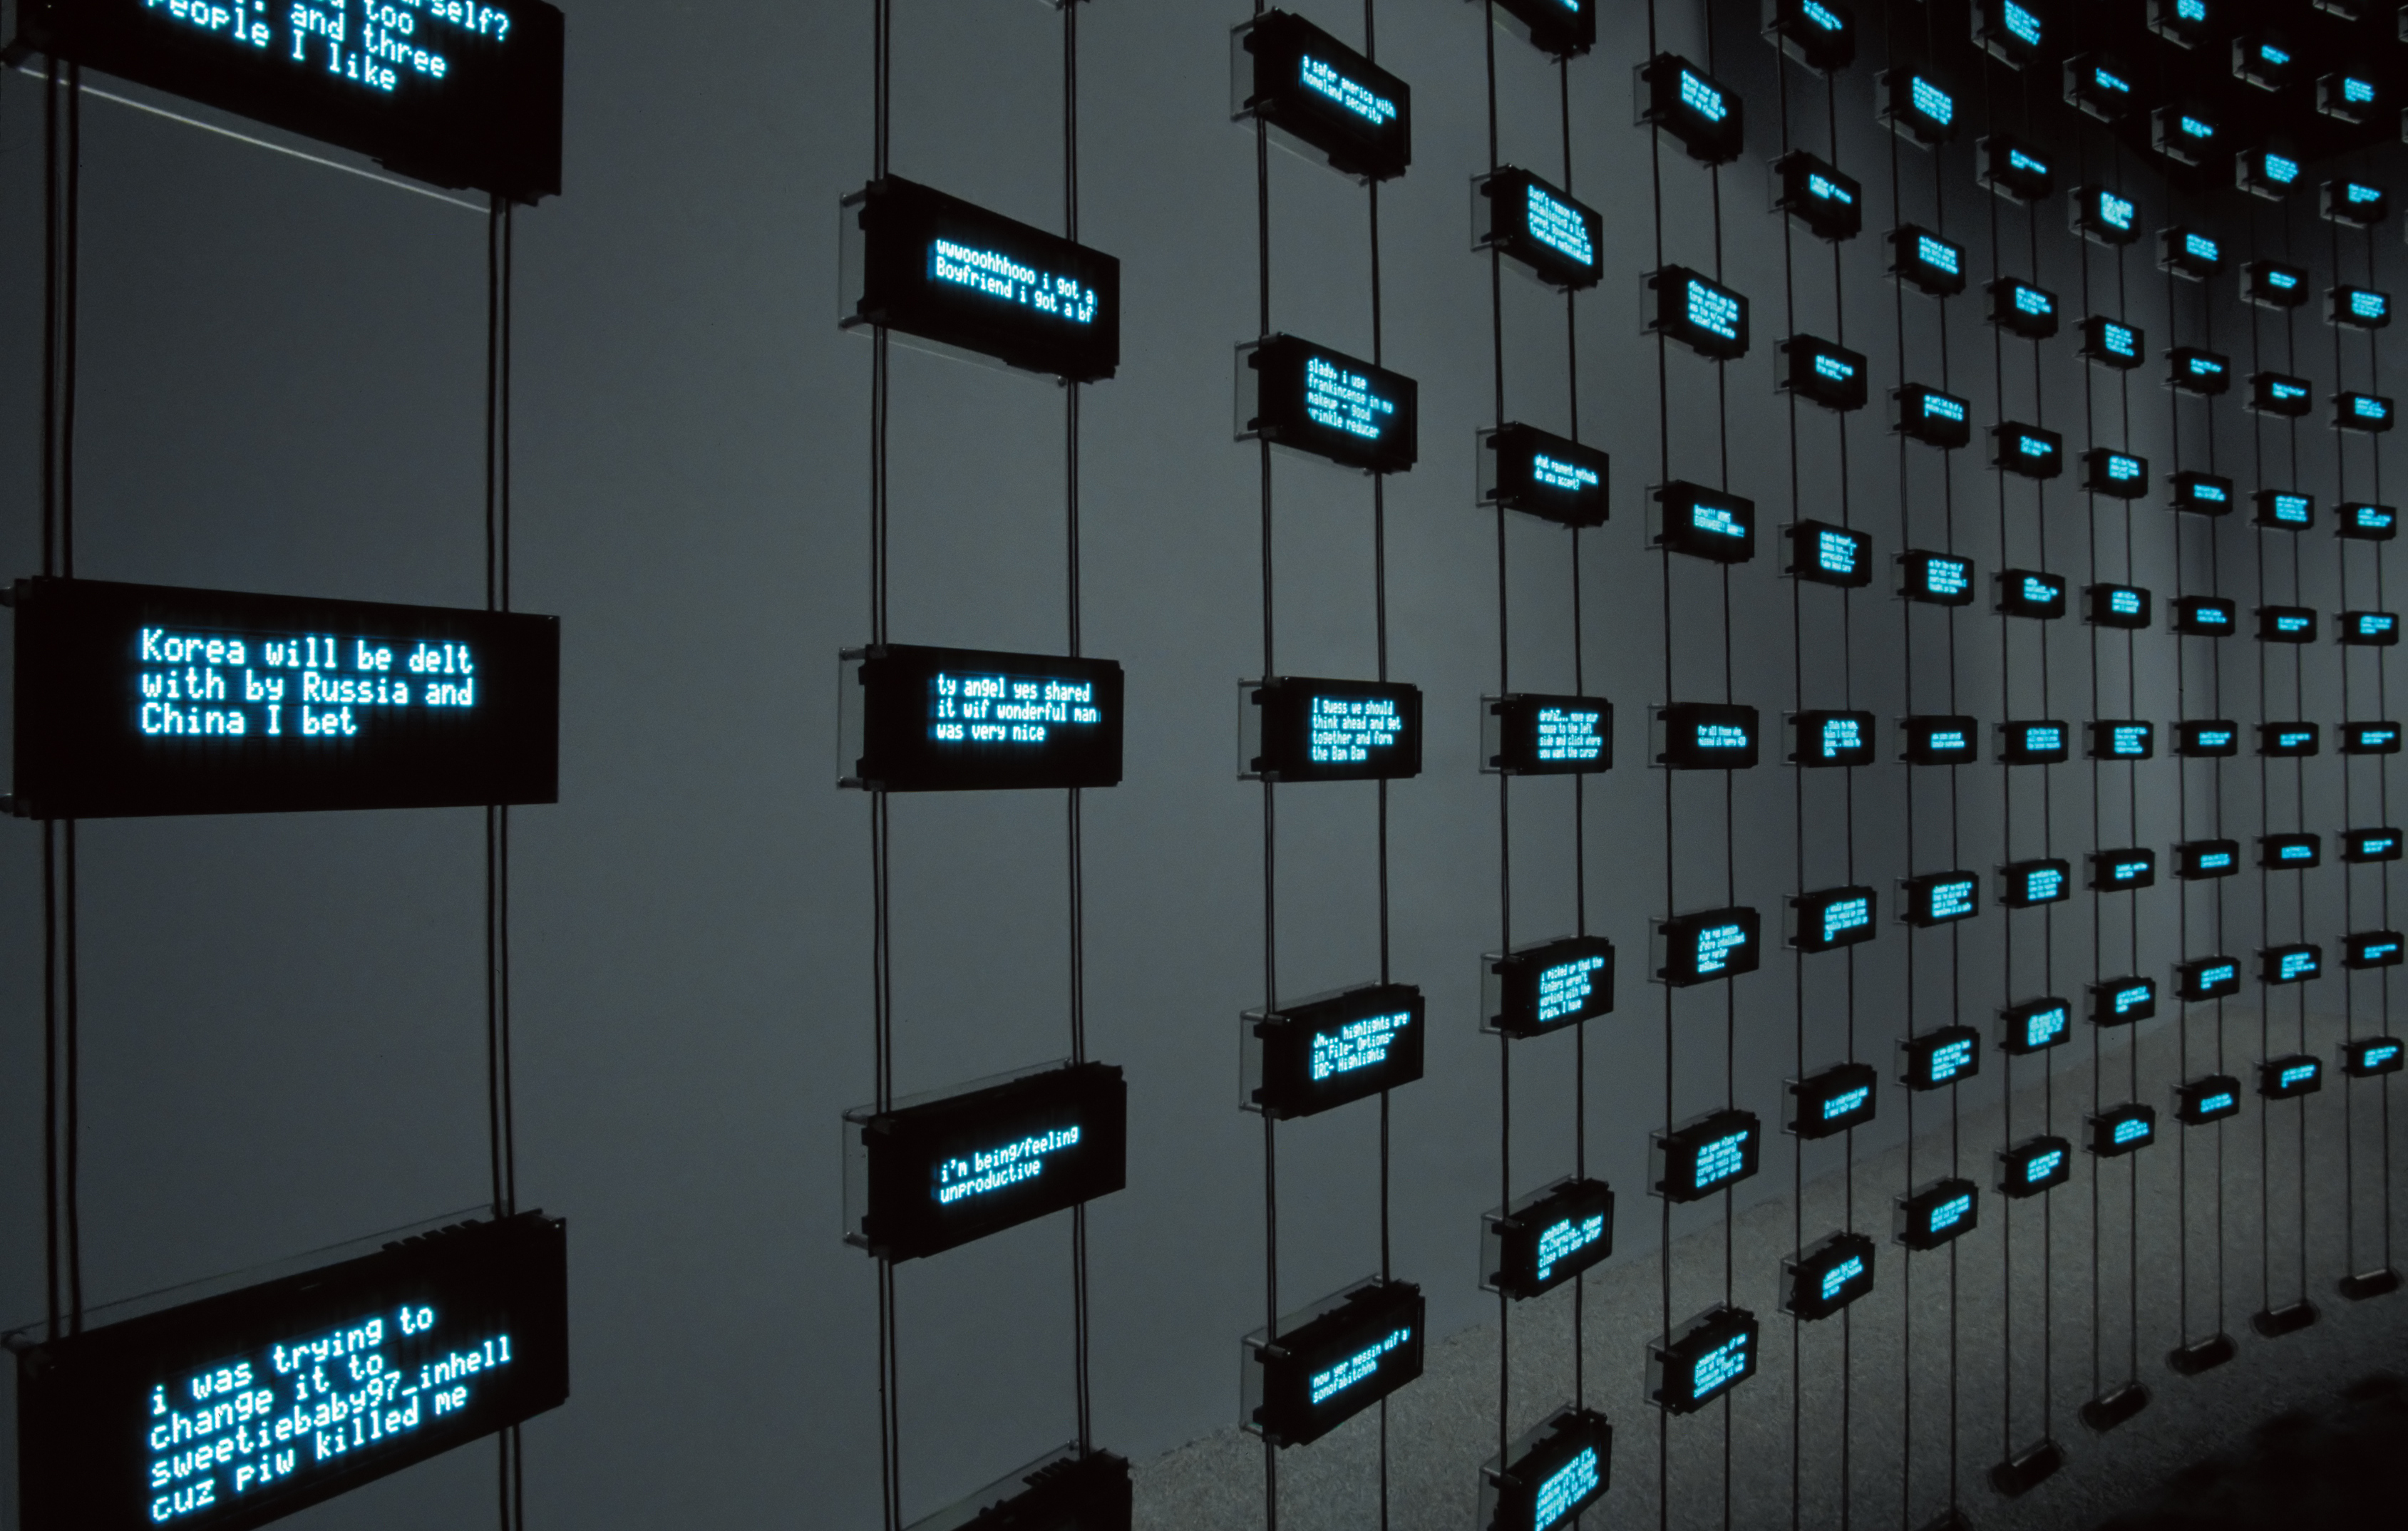
“Listening Post” is a 2001-2003 piece by UCLA statistics Professor Mark Hansen and artist Ben Rubin. The project displays text from conversations in public online chat rooms. Credit: Ben Rubin.
Mark Hansen was supposed to retire at Bell Laboratories, the research and development arm of AT&T.
But he soon became so involved with statistics research that he went on to teach the subject at UCLA.
Hansen’s work has come to highlight the often overlooked relationship between science and art.
Hansen’s first interdisciplinary project was in 1998-1999 with Ben Rubin, artist and founder of EAR Studio in New York City.
Rubin, the artist, and Hansen, the statistician, were brought together by an event organized by the Brooklyn Academy of Music and Alcatel-Lucent, a spin-off of Bell Laboratories.
The collaboration resulted in Listening Post, a project that displays text from conversations in unrestricted online chat rooms.
The words and phrases are suspended on 231 text displays and read by a voice synthesizer, bringing a musical element to the art.
Hansen’s work with text did not stop there. He and Rubin collaborated again in 2007, this time with The New York Times, creating Moveable Type.
Somewhat similar to Listening Post, the art project uses digital displays to showcase text from the entirety of The New York Times archives as well as commentary on the web by readers.
Using complex algorithms, Hansen worked with Rubin to filter sentences from articles and reader interaction, inspiring a sense of history, yet timeliness with the news of the day.
“In my mind he’s every bit as much the artist in our projects as I am,” Rubin said. “(He has allowed me) to see the world through the eyes of someone who thinks about the world statistically.”
Moveable Type was more of an artistic tribute to journalism. Hansen’s newest project with The New York Times is called Project Cascade and focuses more on data modeling and data visualization.
Project Cascade enables The New York Times to see how social networks redistribute links from its site to see the chain effect of sharing on the Internet. He worked this time with data artist Jer Thorp.
“Collaborating with artists is something I find myself doing increasingly,” Hansen said, laughing. “In some ways they do my job better than I do.”
He said he admired the intuition about visual, data and sonic design that the artists possess.
Hansen is also collaborating with Rubin and Elevator Repair Service, a New York City theater group.
Together they are preparing a presentation called “Shuffle” to celebrate the New York Public Library centennial.
“Shuffle” uses statistical algorithms to study words. In this case, Hansen and his collaborators juxtaposed the content and structure of text, such as F. Scott Fitzgerald’s “The Great Gatsby.”
For someone who is used to computer work, Hansen referred to working with live actors as “an epiphany,” since the live performance and interpretation of Hansen’s algorithms add a new dimension he has yet to experience.
“We get to see what happens when these two worlds collide, audience and theater,” said John Collins, artistic director of Elevator Repair Service.
And Hansen’s work connecting statistics and art continues. Hansen, Thorp and Rubin have recently been assigned to commission a Sept. 11 memorial involving data visualization that will study the effects of the terrorist attacks in the past and today.
